 Evidence Based
Water plays an important role in our world. Not only do we need drinking water to survive, but we also use it for bathing and cleaning.
While we all use water, we might be taking it for granted. As the Environmental Protection Agency explains[1], less than 1% of Earth’s water can be used. Our water supply remains constant, but the population is increasing, leading to concerns for sustainability.
This means that water demand is on the rise while water availability remains stable. It’s also important to consider that not all water is high-quality enough for consumption.
Given these facts, it’s important to take a look at water statistics. These give us an idea about our water use, as well as the pathogens that potentially exist in the water supply.
Learning about problems like microbiologically contaminated drinking water might motivate us to fight for change.
Key Facts About Water In The USA
- In 2023, 55%[2] of Americans are concerned a great deal about water pollution.
- Water scarcity will be a problem for at least 40 states by 2024[3], as government reports show
- The largest use of water in the U.S. is for toilets, which comprise 24%[4] of water usage.
- Wyoming has the dirtiest waterways of all states[5] for swimming (96%), followed by Michigan (95%).
- About 7.15 million[6] people each year become ill from waterborne pathogens.
- Waterborne illnesses cost the U.S. $3.33 billion[6] annually in healthcare expenses.
- Just 19%[7] of Hispanic Americans and 24%[7] of Black Americans trust the water supply, compared to 43%[7] of Whites.
Water Statistics In America
General Facts
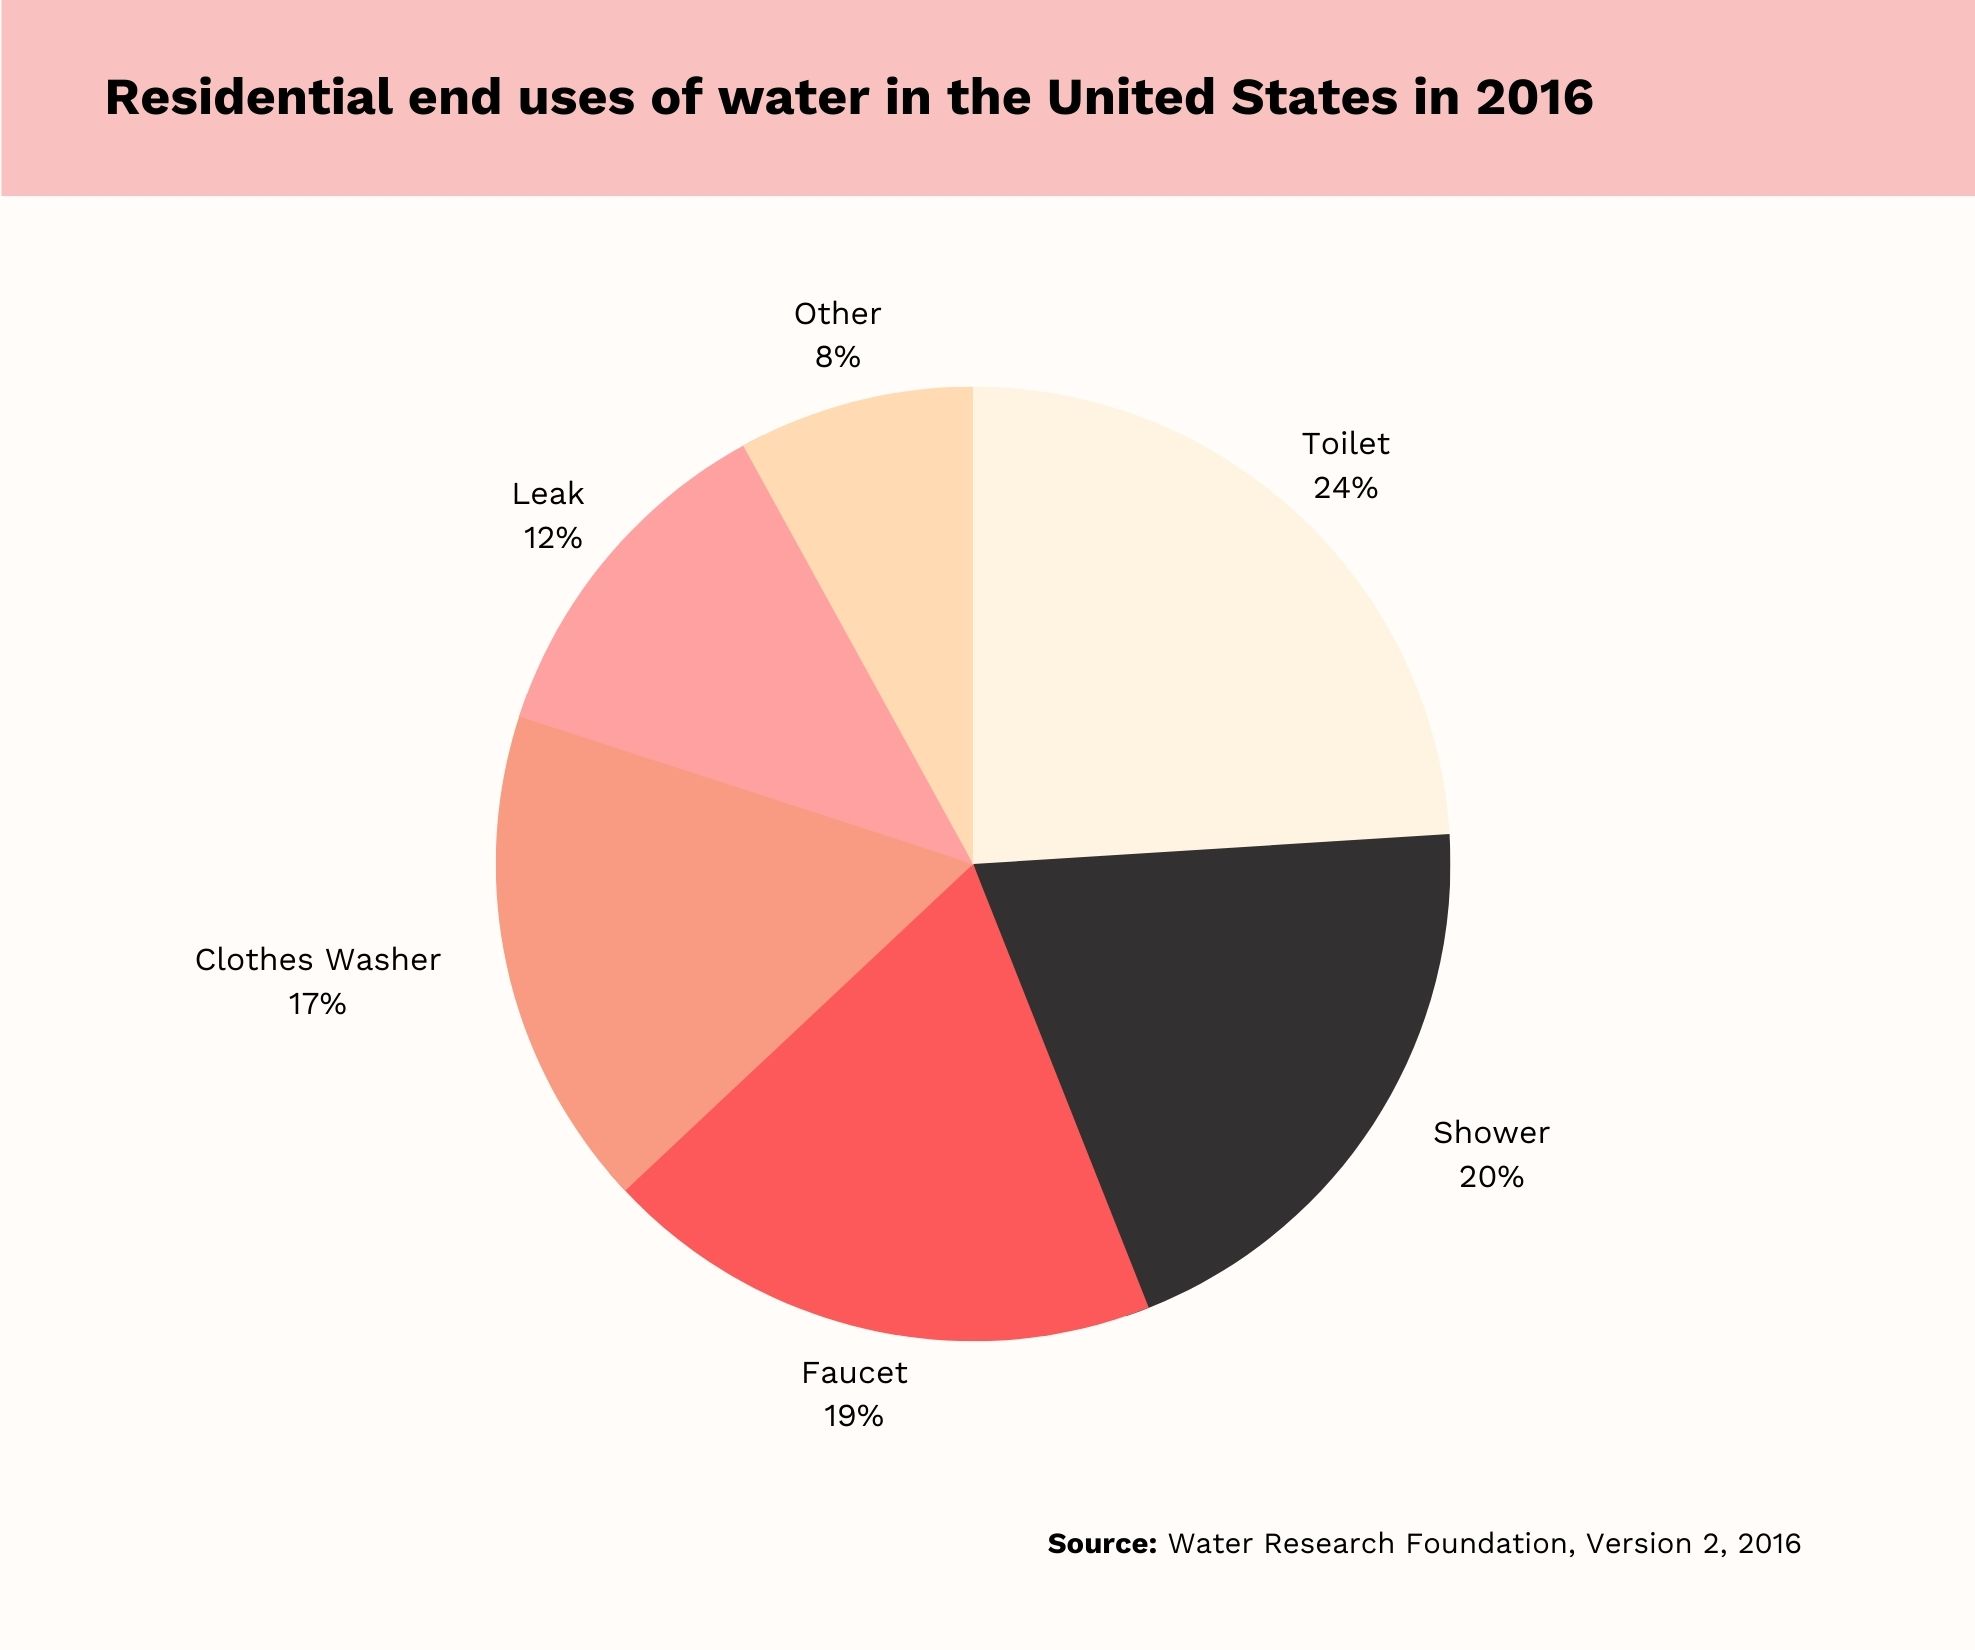
- According to a Water Research Foundation report in 2016[4], the largest portion of water use in the U.S. was for toilets. Toilets accounted for 24%[4] of water use. Water used in the shower fell closely behind, at 20%[4].
- The average American family uses more than 300 gallons of water[1] per day at home. Roughly 70% of this use occurs indoors.
- Surface sources account for 74%[8] of all water withdrawals that occurred in 2015.
- Among the 50 states, the largest amount[8] of water withdrawal occurred in California. The lowest amount[8] occurred in Vermont.
[Additional content & conclusions]
In the United States, most water consumption is due to bathing, toileting, and cleaning. Together, water used in the toilet, shower, faucet, and clotheswasher comprises 80%[4] of water use. Just 8%[4] of water used is for other reasons, and 12%[4] is from leaks.
Water Pollution And Public Concerns
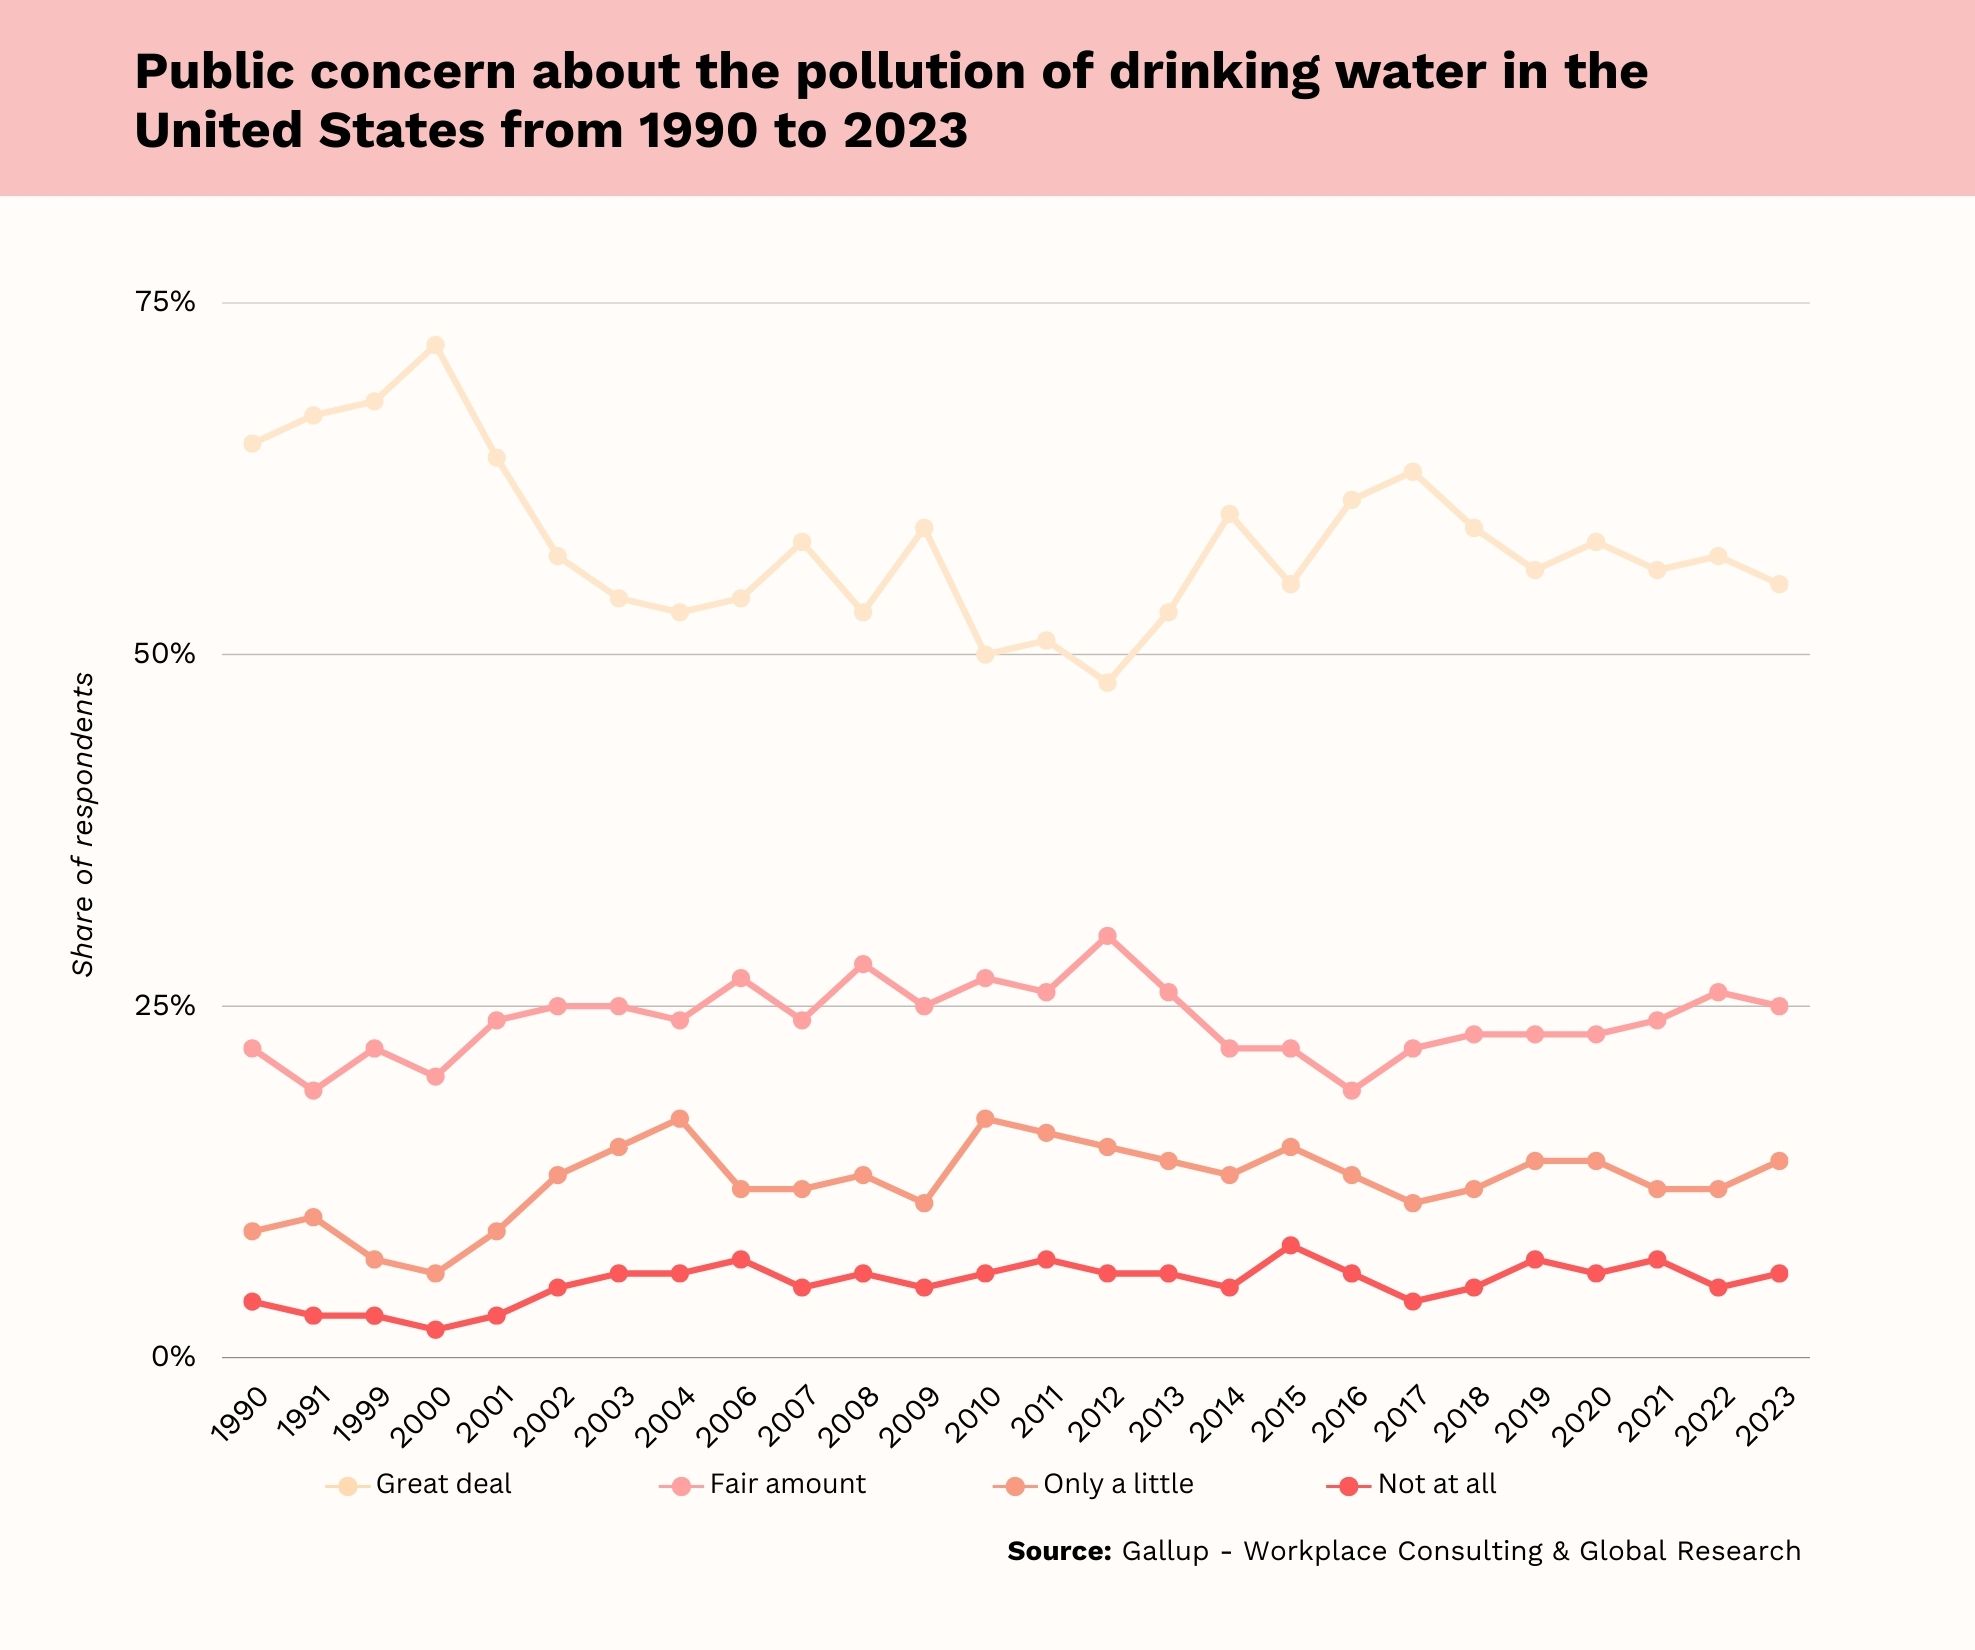
- As of 2023, 55%[2] of Americans were concerned “a great deal” about the safety of drinking water. This percentage has decreased since 2000, but contaminated water remains a top concern[9] among Democrats and Republicans.
- More Americans[2] are concerned a great deal or a fair amount about water pollution when compared to those concerned only a little or not at all.
- A recent report found that Florida has the dirtiest lakes among all states. A total of 873,340 miles[10] of lakes in the state are unsafe for swimming and recreation.
- Michigan has the second dirtiest[10] (95% impaired) waterways in the country for swimming, followed by Wyoming (96% impaired), according to water pollution statistics.
- Perfluorooctanoic acid and perfluorooctane sulfonate are two of the most dangerous chemicals in water systems. A report from the Environmental Protection Agency shows that 220 water systems[11] have some level of these two chemicals.
Over half of Americans are concerned about unsafe drinking water, suggesting that this is a legitimate concern. This is much higher than the proportion of Americans concerned, either a little or not at all.
There is some good news, however. In 2000, 72%[2] of Americans were concerned a great deal about drinking water quality. So, the concern for safe drinking water has declined over the past two decades.
However, universal access to clean water remains a concern in the U.S. Whether a person has a trusted drinking water source depends upon socioeconomic factors. Race is one such factor, according to water pollution statistics.
According to 2021 statistics on water pollution, just 24%[7] of Black Americans are very confident in water quality. Hispanic Americans are even less confident, with just 19%[7] trusting the water supply. Finally, 43%[7] of White Americans say they’re very confident in water quality.
Conversely, 35%[7] of Black Americans and 32%[7] of Hispanic Americans think safe water is a major problem. This is compared to 28%[7] of White Americans.
Burden Of Waterborne Disease In The United States
CDC[6] estimates that 1 in 44 people in the United States gets sick each year from waterborne diseases.
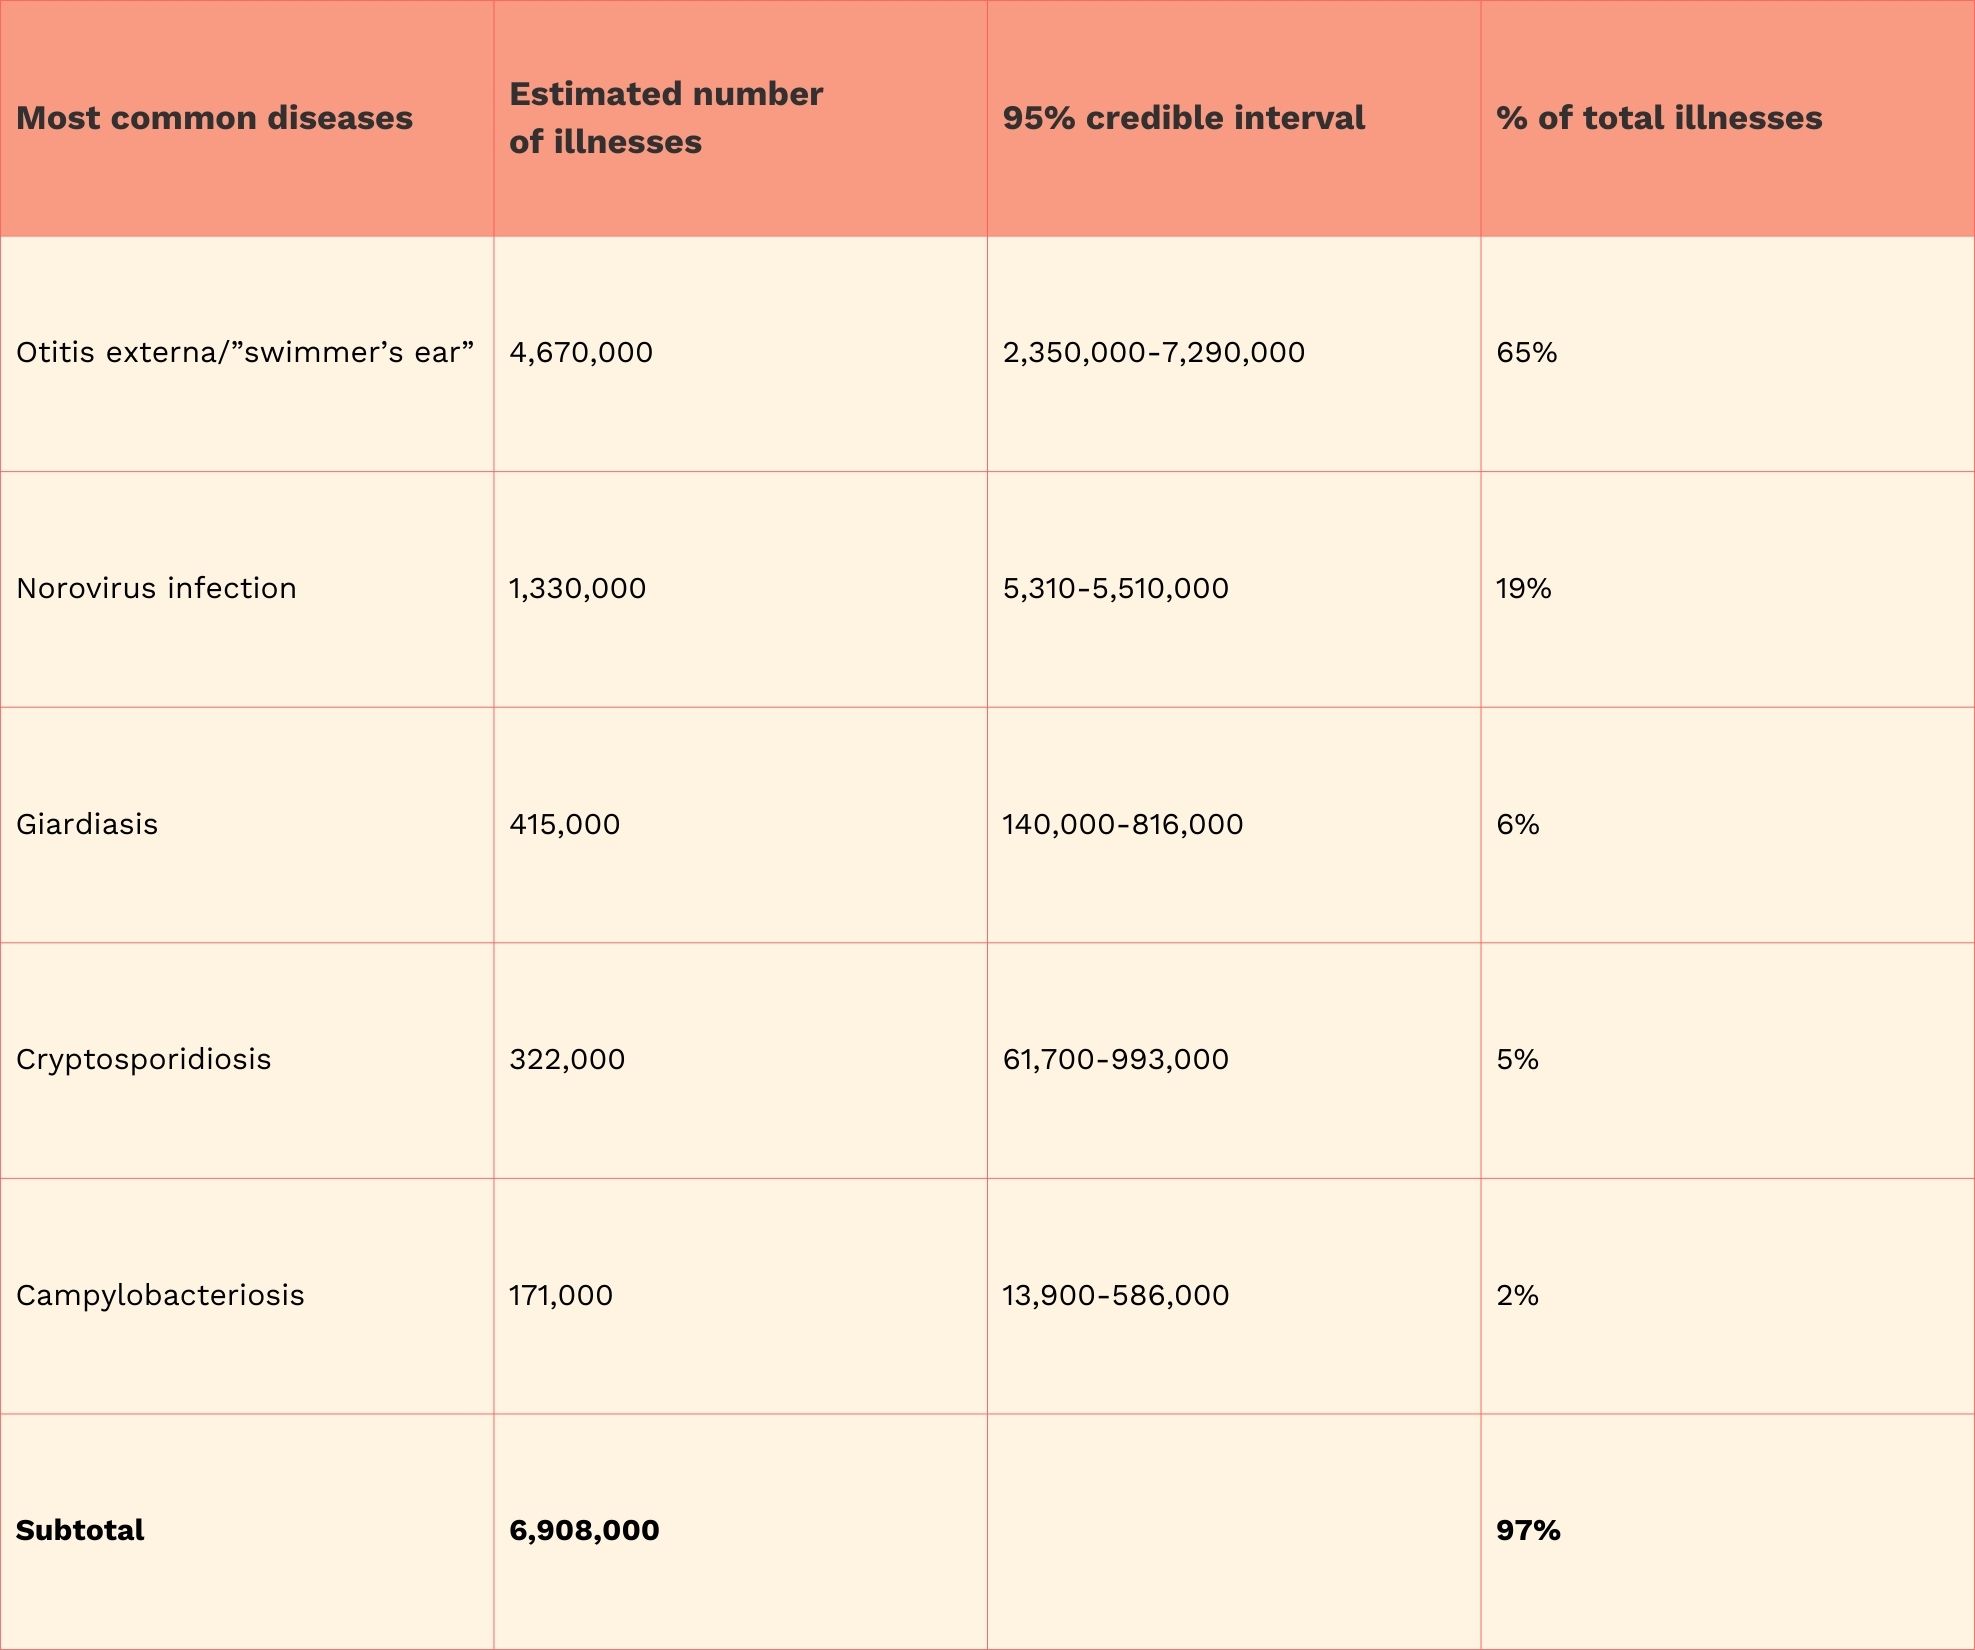
- The most common cause of waterborne disease in the United States is otitis externa. Also called “swimmers’ ear,” this illness accounts for 65%[6] of waterborne diseases.
- An estimated 17 waterborne pathogens cause a total of 7.15 million[6] illnesses per year.
- Behind “swimmer’s ear,” the second most common water-related disease is norovirus infection. This accounts for 19%[6] of waterborne illness.
- Other waterborne infections are rather rare. Giardiasis, cryptosporidiosis, and campylobacteriosis account for 6%[6], 5%[6], and 2%[6] of water-related diseases, respectively.
While people may not think of dirty water as being dangerous, the truth is that it can be quite risky. Each year, waterborne illnesses cause 601,000[6] emergency room visits and 118,000[6] hospitalizations. Unfortunately, 6,630[6] people die each year from medical problems associated with unsafe water.
The costs of poor water quality are also staggering. Annually, waterborne illnesses result in $3.33 billion[6] in healthcare costs.
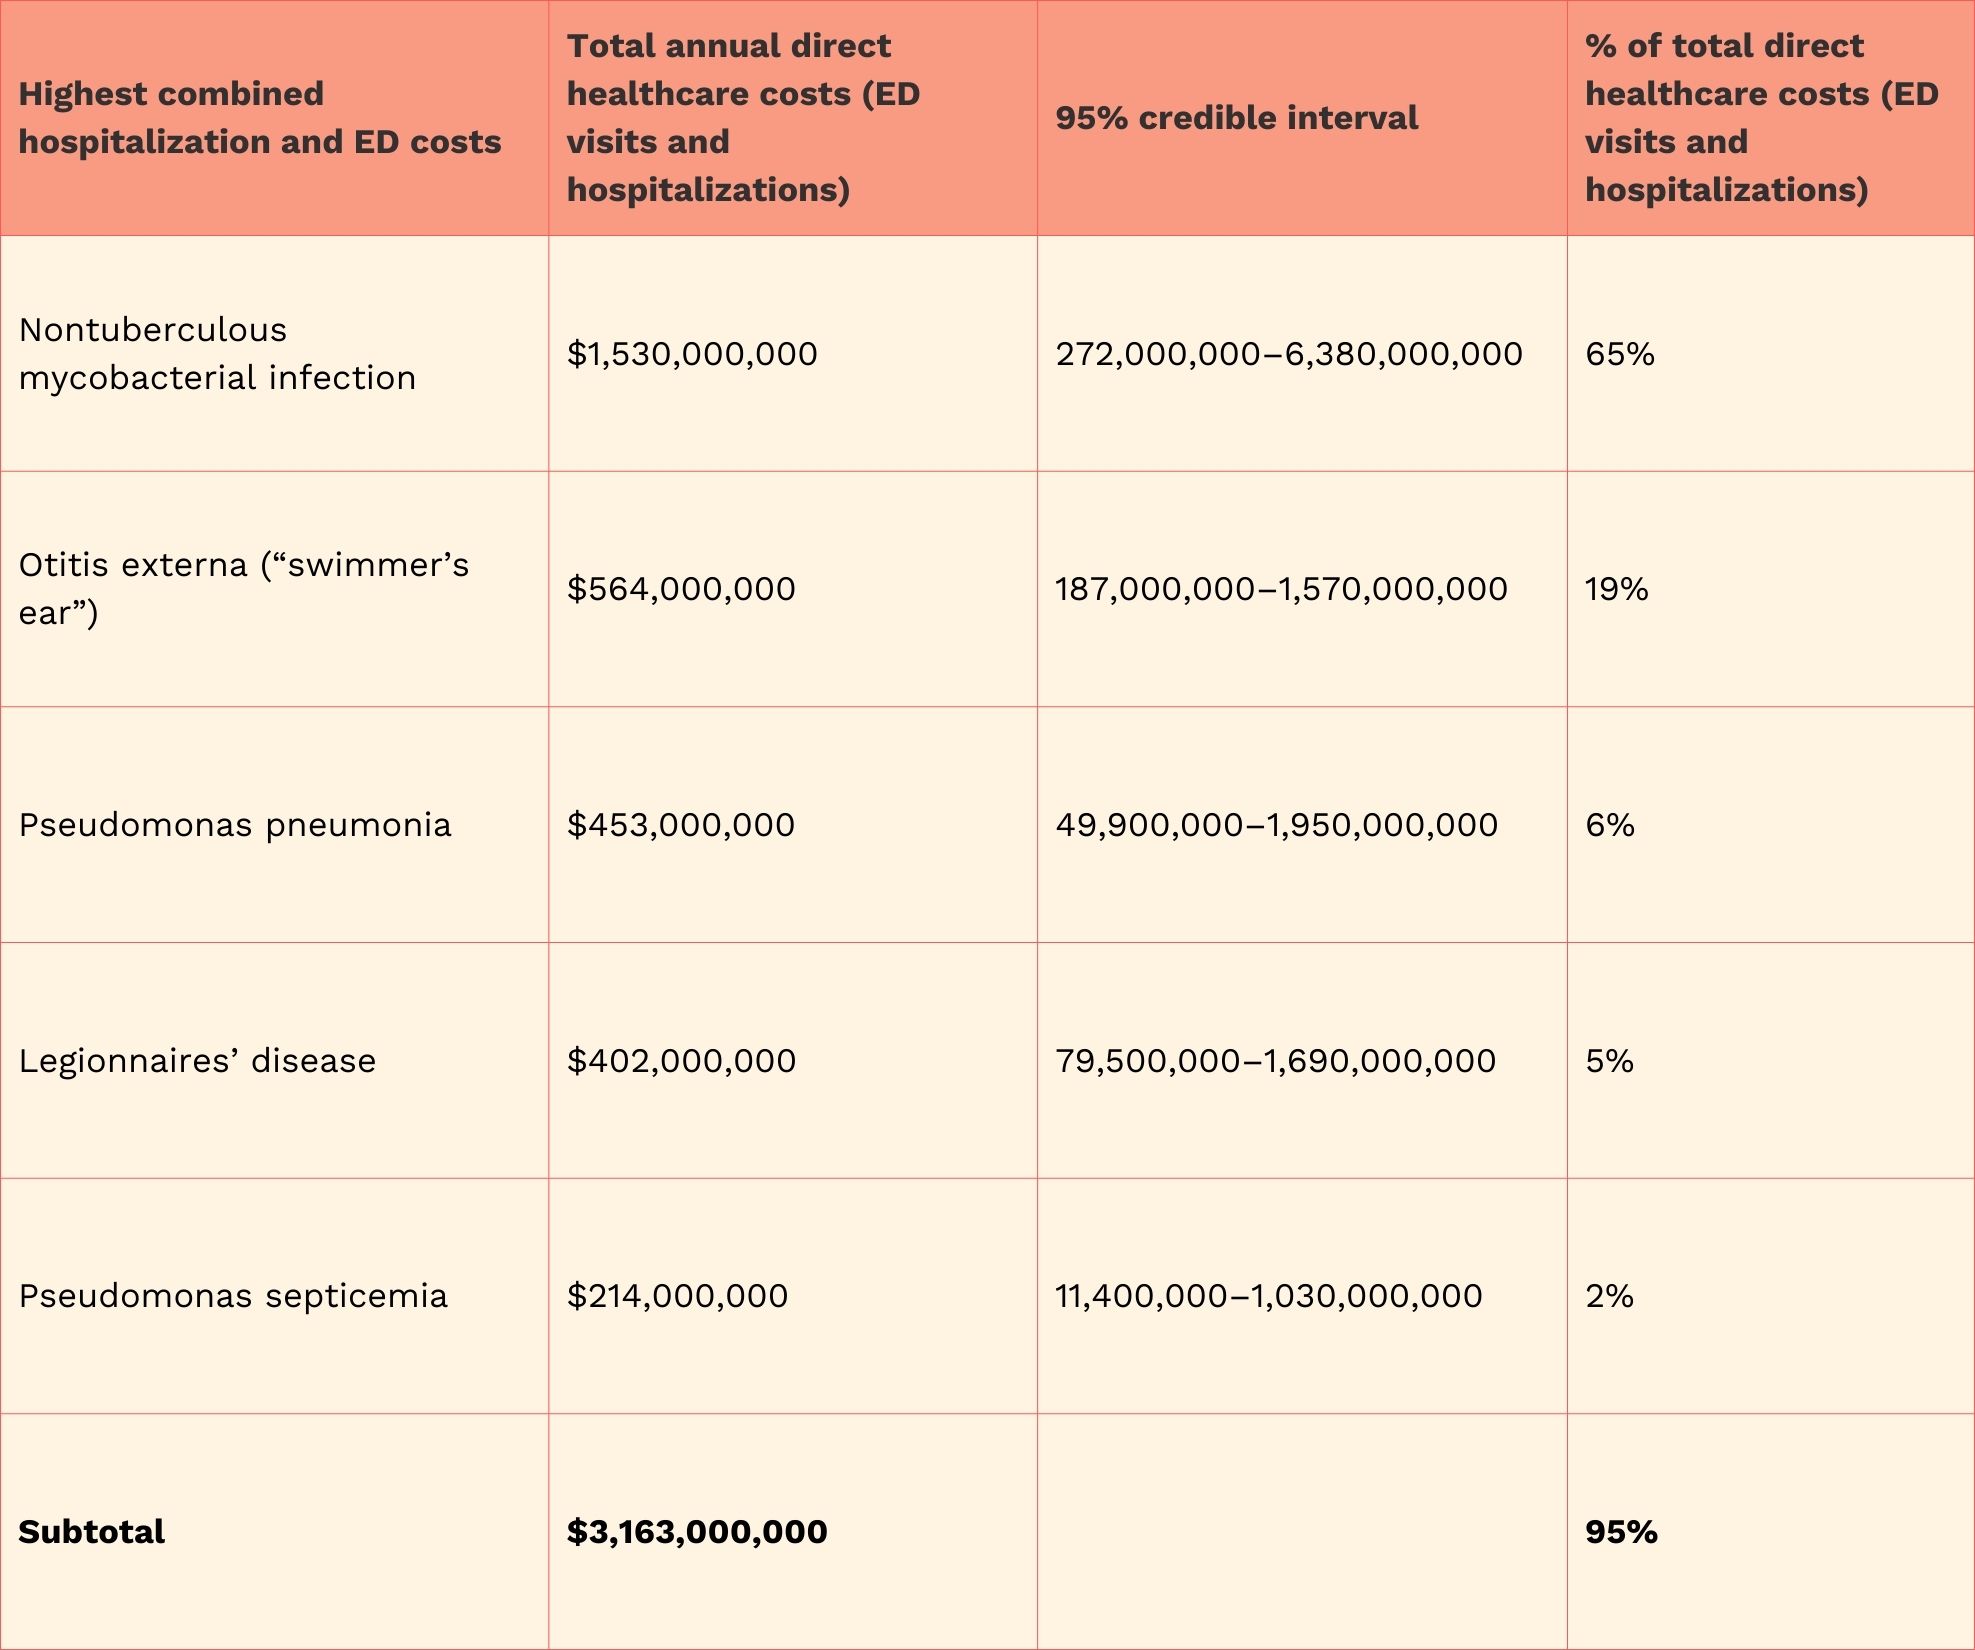
- Nearly half of the medical costs from contaminated water are due to nontuberculous mycobacterial infection. This illness contributes to $1,530,000,000[6] in combined hospitalization and emergency department visits annually, 46%[6] of the total costs from waterborne illness.
- Otitis externa is the second most costly waterborne illness, contributing to $564,000,000[6] in yearly expenses. This contributes to 17%[6] of the total cost related to illnesses from dirty water.
- The least expensive waterborne disease, pseudomonas septicemia, still costs $214,000,000[6] per year in medical expenses, just 7% of the total cost of waterborne illnesses.
Swimmer’s ear might cause the most waterborne illnesses each year, but it is not the most expensive to treat. Nontuberculous mycobacterial infection is the most costly waterborne illness in terms of annual healthcare expenses.
Tips To Protect Your Drinking Water
Environmental health experts have reported[12] that we can take steps to promote safe drinking water. Some of these steps involve changing how we use and dispose of materials daily. Others involve advocating for change at the community level.
Promoting Safe Drinking Water At Home
First, it’s important to refrain from pouring hazardous chemicals down drains, storm sewers, or on the ground.
Some hazardous chemicals that can cause[12] water pollution include motor oil, pesticides, and old paint cans. Mothballs, flea collars, household cleaners, and medicines can also be dangerous. Safely managed drinking water requires us to be mindful of what we are potentially dumping into the drinking supply.
You can avoid contaminating your water supply by following disposal instructions[13] on product labels. If you’re unsure how to dispose of materials, contact your local waste management service. They can tell you how to prevent contaminants from entering the groundwater supply.
It’s also important to be mindful of using pesticides and fertilizers. Use them only according to the instructions on the label, and consider limiting your use. These products contain harmful chemicals[12] that can contaminate the water supply.
Other important water sanitation and hygiene actions include maintaining your septic system[12]. A professional should inspect your system every three years. If your system malfunctions, it could transmit diseases by contaminating local waterways with bacteria and viruses.
Finally, participate in pharmaceutical take-back programs, allowing you to dispose of unused medications safely. When you flush these down the toilet, they can enter[12] water sources like streams and rivers. These sources may flow into the local drinking water supply.
Volunteering To Promote Clean Water
Your choices at home can fight against unsafe drinking water, but community-level efforts are also needed. Consider joining a local beach or stream cleanup crew to remove sources of contamination from the water supply.
You can also work with your local water utility to educate the public about safely managed drinking water. They might be willing to work with you to initiate a public education campaign. This could include posting messages on billboards or sending informational flyers with monthly water bills to promote safe habits.
How To Save Water Effectively?
Water conservation is important because government reports show that at least 40 states[3] will have a water shortage by 2024. Fortunately, there are things you can do at home to save water. Individual changes are important, but engaging in community-level conservation efforts is also essential.
Saving Water At Home
First, incentivize your water conservation efforts by tracking your monthly water bill. When your own costs go down, you’ll be more likely to continue your efforts to save water. Be sure to turn off the water when brushing your teeth, and avoid lengthy showers.
Other strategies, such as lowering water pressure when washing the dishes, can also make a difference. Track the decreases in your water bill as you implement these changes to see how effective they can be.
We can all save water by being mindful of the products we use. The Environmental Protection Agency places a WaterSense label[13] on products that efficiently use water. Choose these products, and encourage your loved ones to do the same.
In addition to the changes above, the following small steps[14] can lead to less water use:
- Wait until you have one load of dirty clothes to do laundry, rather than washing half-loads at a time.
- Check for problems like a leaky toilet, which can waste water.
- Use a dishwasher rather than washing dishes in the sink with running water.
- Ensure the dishwasher is full before running it.
- Sweep the driveway instead of hosing it off after mowing.
- Shower rather than take a bath since baths use more water.
All of these steps add up to more efficient use of water, which lowers your bills and contributes to conservation.
Community-Level Water Advocacy
While your own efforts can make a difference, the truth is that large-scale water conservation efforts are necessary. Encourage friends and family members to reduce their water use and take part in community initiatives to conserve water.
If your local waste management or parks and recreation district hosts community events, consider volunteering. You might give a public presentation about water conservation or pass out educational materials to event attendees.
Educate colleagues, friends, and other community members about steps they can take to reduce their own water use.
Conclusion
Water use data show that we need to take steps to conserve water. The typical American household uses over 300 gallons[1] of water per day at home. With rising water demand, at least 40 states[3] will have a water shortage by 2024.
Statistics about water pollution are also concerning. Waterborne diseases cause 7.15 million illnesses[6] each year, resulting in 6,630 deaths[6]. Access to safe water remains a top concern for our population.
Given these facts, it’s essential that we all become more intentional about addressing issues like poor sanitation. By disposing of hazardous materials properly, rather than dumping them down the drain, you can make a difference.
You can also fight against water shortages by reducing your use at home. Taking long showers, leaving the water running, and failing to fix a leaky toilet can all contribute to waste.
Hopefully, learning about the domestic use of water and statistics related to waste and pollution has motivated you to make changes. Now is the time to take action, which requires not only making changes at home but also educating others. Spread the word about conserving water and promoting basic drinking water services free from contamination.
Frequently Asked Questions
According to data from water bills, the monthly cost of water has increased consistently since 2013. Between 2020 and 2021, water bills increased by 4.31%.[15] Water is becoming more expensive, and this trend does not appear to be stopping.
According to the Environmental Protection Agency[16], the agricultural and thermoelectric power industries are the largest water consumers in the United States
According to the most recent data, California and Texas[8] have the largest amount of water consumption.
Government data[3] suggests that a water crisis is looming. At least 40 states[3] are predicted to have a water shortage by 2024. The population has doubled, while water demand has tripled.